
Q1 2024.
This update intends to inform you about relevant market developments and market insights in the digital asset market.
In this edition, we will unveil key insights and events in both the digital assets market and traditional financial markets from January 1 to March 31, 2024. Due to its significant relevance, we also include the Bitcoin halving that occurred on April 20 1am CET already in this Q1 market update.
Our goal is to empower you with a strategic perspective on how these developments impact crypto investments, whether you are already part of the M21 family or considering joining us as investor in this ever-evolving landscape.
| Delta Jan | Delta Feb | Delta March | Delta Q1 | |
| Bitcoin | 1.54% | 42.30% | 16.81% | 68.78% |
| Ethereum | 0.04% | 46.58% | 59,82% | 59,89% |
| Total market cap digital assets | -1.25% | 38.86% | 18.95% | 63.12% |
| Total market cap altcoins (excl BTC, ETH & stable) | -9.59% | 34.99% | 37.95% | 68.36% |
| Nasdaq 100 | 1.84% | 5.26% | 6,54% | 8,5% |
| S&P 500 | 1.59% | 5.22% | 8.44% | 10.17% |
KEY TAKEAWAYS
- January 10, 2024, marked a significant milestone for the digital assets market as the SEC granted approval for 11 Bitcoin spot Exchange Traded Funds (ETFs).
- This approval marks a major milestone in the digital asset market, potentially attracting a large new investor base and formalizing its status as an institutional asset class.
- The impact of this Bitcoin ETF approval was already significant on short term. Over Q1 2024, Bitcoin ETFs rapidly absorbed over 4% of the total BTC supply in less than three months.
- As of March 31, 2024, spot Bitcoin ETFs have accumulated nearly $60 billion in Bitcoin assets.
- This influx has not only propelled Bitcoin to new all-time highs already before the Bitcoin halving (where in previous cycles this was only after the Bitcoin halving) but also spurred broader demand for crypto assets with a 63.12% overall increase in the digital assets market value.
- The long awaited fourth Bitcoin halving occurred on April 20, 2024, 1AM CET.
- Based on previous market cycle patterns, the Bitcoin halving could be set for a potential significant surge in Bitcoin’s value and the overall digital assets market value.
- It is important to note that this potential impact might not be immediate. Analysis shows it can take up to 100 days after the halving to see a statistically significant change in price.
- Inflation increased with 0.1% over Q1 2024, raising serious concerns that expected interest rate decreases will be delayed and potentially even increased. These current macro-economic conditions might disrupt the historical pattern of price increases following previous halvings on short term.
- With the updated “post halving” Bitcoin supply-demand dynamic and the growing interest of (institutional) investors, the conditions are in place for an increase in both Bitcoin value and the overall digital assets market value on longer term
Update on catalysts of digital assets markets
CATALYSTS
There are three major catalysts to watch that will have a major influence on the digital assets market in 2024:
- Institutional adoption via Bitcoin ETFs.
- the Bitcoin halving.
- Macro-economic developments (inflation and interest rate policy).
CATALYST 1: INSTITUTIONAL ADOPTION
Bitcoin ETF – Q1 results
In our Q4 2023 newsletter we outlined that the US Securities and Exchange Commission (SEC) approved eleven spot Bitcoin exchange-traded funds (ETFs) and the transformation of the Grayscale Bitcoin Trust (GBTC) into an ETF on January 10, 2024, and how this approval marks a major milestone in the digital asset market, potentially attracting a large new investor base and formalizing its status as an institutional asset class.
The impact of this Bitcoin ETF approval was already significant on short term in terms of money inflow. Over Q1 2024, Bitcoin ETFs rapidly absorbed over 4% of the total Bitcoin supply in less than three months. This influx has not only propelled Bitcoin to new all-time highs already before the Bitcoin halving, but also became a significant factor in the increase of the overall digital assets market value.
As of March 31, 2024, spot Bitcoin ETFs have accumulated nearly $60 billion in Bitcoin assets.
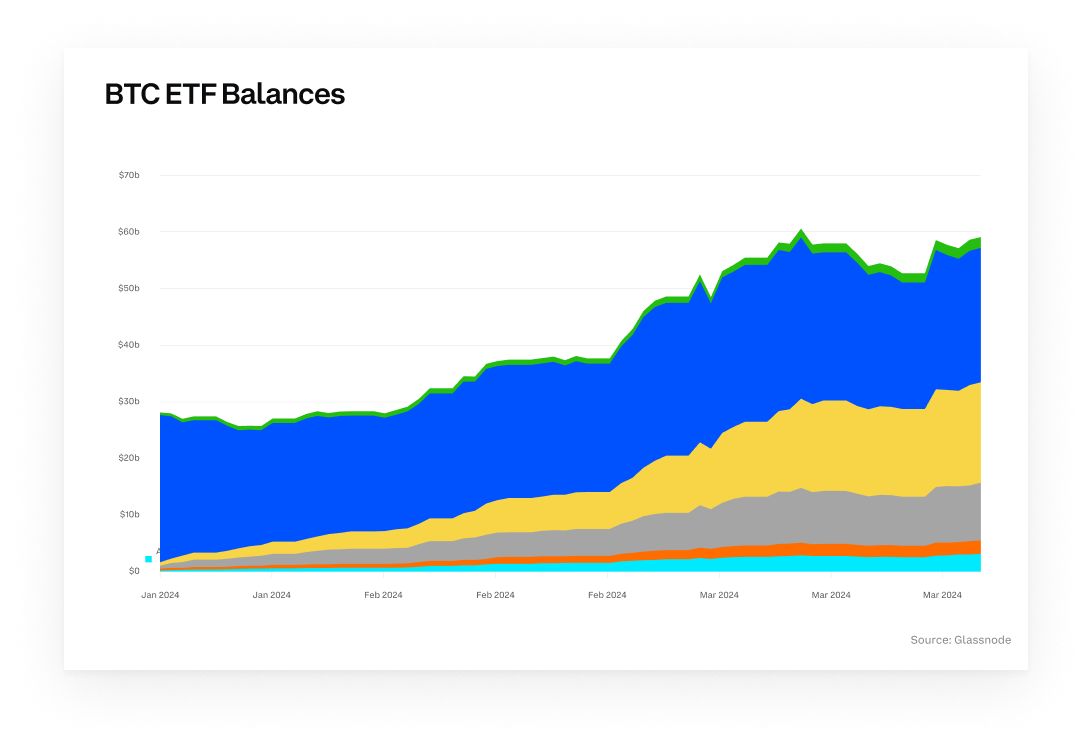
Source: Glassnode & Coinbase institutional – Q2 2024
Other relevant institutional adoption news:
- BlackRock launches first Real-World Assets Tokenized Fund on Ethereum
- BlackRock’s $10 Trillion Tokenization Vision: The Future Of Real World Assets
- Hong Kong regulators approve launch of spot Bitcoin and Ethereum ETFs
CATALYST 2: BITCOIN HALVING
The long awaited fourth Bitcoin halving, which is usually referred to as “the halving”, occurred on April 20, 2024, 1AM CET with the mining of block 840,000. While this event happened in early Q2 2024, we will cover it in this market update as it is a significant milestone that historically signals shifts in market dynamics.
Halvings take place each time 210,000 blocks have been mined, which happens roughly every four years, and will continue to take place on the same schedule until all 21 million Bitcoin have been mined, around the year 2140. This process is meant to control the supply of Bitcoin over time and affords Bitcoin its unique status as a programmatically disinflationary asset.
With each Bitcoin halving the number of Bitcoin miners can potentially receive for each block mined is cut in half. After the halving of April 20, miners’ block rewards dropped from 6.25 BTC to 3.125 BTC per block mined.
The potential impact of the halving on price
While not guaranteed, the halving has the potential to significantly impact Bitcoin’s price. The previous three halvings resulted in a Bitcoin price increase of 559% (2020 halving), 284% (2016 halving) and 8.069% (2012 halving). In addition, the total market cap of altcoins has increased in value in a similar pace.
The logic behind the potential price surge is that the halving reduces the supply of new Bitcoins entering the market, while demand might rise due to perceived scarcity. With miners selling less and investors potentially more eager to buy, the price could increase. This narrative was especially emphasized after the launch of spot Bitcoin ETFs (refer to next section) that have attracted significant assets under management in a brief period of time.
It is important to note that this potential impact might not be immediate. Analyses suggest it can take up to 100 days after the halving to see a statistically significant change in price.
BTC price performance since halving
Bitcoin has completed four cycles that each included both bull and bear markets. The chart below measures the total return on investment of Bitcoin during each of the previous halving cycles (epochs).
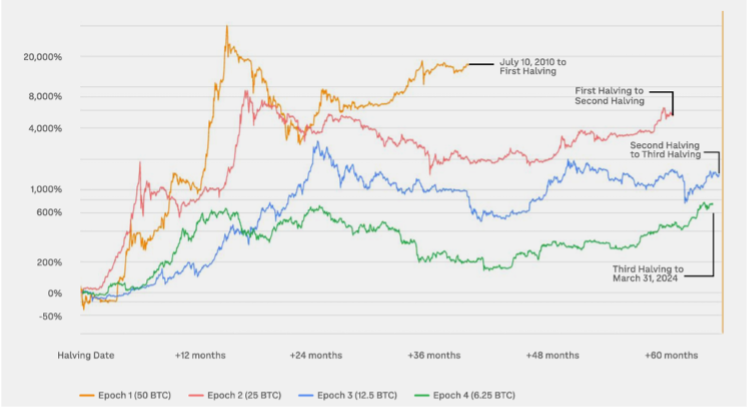
Source: Glassnode & Coinbase institutional – Q2 2024
Key highlights from the previous market cycles are:
- Within 12 months following the prior three halvings, the Bitcoin price appreciated meaningfully.
- Following the first halving (2012, red line), prices gained more than 1,000% in the first 12 months.
- Following the second halving (2016, blue line), prices gained 200% in the first 12 months.
- Following the third halving (2020 green line), prices gained more than 600% in the first 12 months.
BTC Price Performance since cycle low
In the current cycle, Bitcoin is up 400%+ as per March 31, 2024, in the 16 months following its cycle low in November 2022 (November 21: Bitcoin price 15,787 USD).
The chart below compares the current market cycle which began in 2022 (black line) to the previous market cycles, with base (0%) the cycle low of that market cycle.

Source: Glassnode & Coinbase institutional – Q2 2024
The current market cycle (16 months in progress) most closely resembles the one from 2018-2022, which ended with Bitcoin up 2,000% 27-28 months after the cycle low.
CATALYST 3: MACRO-ECONOMIC DEVELOPMENTS
INFLATION DATA Q1 2024
Inflation slightly increased over Q1 2024, from 3.4% in December 2023 to 3.5% by March 2024.
| Month (2024) | Actual | Forecast |
| March (Q1 2024) | 3.5% | 3.4% |
| February (Q1 2024) | 3.2% | 3.1% |
| January (Q1 2024) | 3.1% | 2.9% |
| December (Q4 2023) | 3.4% | 3.2% |
| November (Q4 2023) | 3.1% | 3.1% |
| October (Q4 2023) | 3.2% | 3.3% |
FED interest rate policy
The data above shows that inflation is still persistent and is a cause for concern for the Federal Reserve (FED), that has a 2.0% inflation rate target. This data also shows there is a stagnation in inflation decrease, which in turn increases the chance that the Federal Open Market Committee (FOMC) will postpone interest rate cuts. Even an increase in interest rate cannot be ruled out if inflation continues to rise.
FED chairman Jerome Powell will provide more clearance on the interest rate policy for 2024 after the FED meeting on April 30 and May 1.
Digital assets sector
DIGITAL ASSETS: Q4 PERFORMANCE
Digital assets: Q1 performance
Following Q4 2023, also Q1 2024 presented an outstanding performance in the digital assets market, featuring a 68.78% surge in Bitcoin price, a 59,89% surge in Ethereum price, and a noteworthy 68.36% expansion in the total market capitalization of altcoins.
Another remarkable achievement is that Bitcoin already broke its previous all-time high price on March 2024. Bitcoin reached an all-time high price of $73,805.27 on March 14, 2024. What is remarkable is that this new all-time high was already set prior to the Bitcoin Halving, in previous market cycles this occurred only months after the Bitcoin halving.
Correlation with traditional markets
Following November and December 2023, the digital assets market outperformed traditional stock markets significantly in Q1 2024. Since traditional markets are also up, the correlation coefficient is currently positive, between 0.8 and 0.9 (strong correlation). However, the Q1 outperformance of digital assets underscores the growing divergence between the digital assets market and the traditional stock markets.
BITCOIN AND ETHEREUM: TECHNICAL ANALYSIS
| Q1 opening (USD) | Q1 closing (USD) | Q1 closing (USD) | |
| Bitcoin | 42.265 | 71.333 | +68,78% |
| Ethereum | 2.281 | 3.647 | +59,89% |
Bitcoin
As we entered 2024, Bitcoin kicked off the year with a price of $42,265. Despite initial challenges breaking the psychologically crucial $50K barrier, January saw Bitcoin consolidating around this level. However, February showcased Bitcoin’s resilience as it surged past $50K, hitting above $63,000 for the first time since December ’21. This surge was accompanied by soaring RSI and StochRSI levels, fueled by increased volume and volatility, indicating significant market strength. Notably, Bitcoin’s price divergence from the 21-week moving average mirrored patterns seen during the start of the 2021 bull run.
March marked another milestone for Bitcoin as it soared to a new all-time high of $73,805, surpassing the previous cycle’s peak even before the halving event. This swift achievement contrasts with historical trends, where it typically took Bitcoin months post-halving to breach previous all-time highs. The influx of investments from ETFs is reshaping the landscape, evident in the establishment of an accumulation zone between $65K-$73K, reinforcing the previous cycle’s all-time high as a support level. As indicators reset and cool off, the stage is set for potential further upward momentum.
March closed at an impressive $71,333, concluding a monumental first quarter for Bitcoin.
Total Market Value digital assets
The surge in prices propelled the total market value of digital assets to over $2.5 trillion, nearing the former peak of the previous market cycle of over $3 trillion in November 2021. Bitcoin retains dominance with over 54% of this value.
Notably, despite reaching the $2.5 trillion-mark, monthly volatility remains relatively low, signalling potential sustained momentum for months to come.
Total Market Value digital assets excluding BTC (altcoins)
Altcoins, excluding Bitcoin, witnessed a remarkable rise of over 65% in Q1 2024, closely tracking Bitcoin’s trajectory. However, they have yet to outperform Bitcoin significantly.
Currently, the total market cap for altcoins is consolidating within the $1 trillion to $1.2 trillion range, a substantial increase from previous lows but still shy of the 2021 cycle’s peak of $1.7 trillion. Encouragingly, on the weekly timeframe, we observe a pattern of higher lows in RSI and StochRSI, indicating the potential for further gains.
A breakthrough above the $1.25 trillion mark could signal another surge towards the previous all-time highs at $1.7 trillion, underlining the growing optimism and potential within the altcoin market.
SUMMARY
The Bitcoin halving event on April 20, 2024, is anticipated to have a substantial positive influence on the Bitcoin price and consequently on the broader digital assets market. As Bitcoin constitutes approximately 55% of the total market value of digital assets, its performance is likely to drive market trends.
However, attempting to make short-term predictions about Bitcoin’s price is inherently speculative. Past halving cycles have shown varied macro-economic impacts, and current economic conditions characterized by high inflation and interest rates may diverge from historical patterns in the short term.
Nevertheless, a comparison of the present market cycle with previous ones, coupled with the altered supply-demand dynamics resulting from the halving event and increasing interest from institutional investors, suggests favourable conditions for long-term appreciation in both Bitcoin’s value and the overall digital assets market.